商铺名称:深圳佳捷伦电子仪器有限公司
联系人:刘艳(小姐)
联系手机:
固定电话:
企业邮箱:1551787749@qq.com
联系地址:深圳市龙岗区平新北路163号广弘星座B栋12楼
邮编:518111
联系我时,请说是在泵阀网上看到的,谢谢!
商品详情
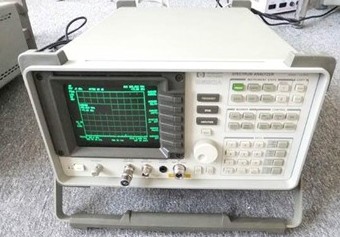
大甩卖HP54118A数字示波器HP54118A甩甩甩HP54118A刘艳15994802706
=======================================
深圳佳捷伦电子仪器有限公司
联系人:欧阳璋/刘艳
手机:13510500080/15994802706
电话:0755-83761995
传真:0755-83761995
Q Q: 2355633960
邮箱:cgilent@126.com
网站:www.cgilent.com
全国免费热线800-900-9128
全国免长途通话费400-996-9128
地址:深圳市龙岗区平新北路163号广弘星座B栋12楼
========================================
Agilent 54123A Oscilloscope, Digital: 34GHz,4ch (System (multipleinstruments)
The Agilent 54123A oscilloscope is a graph-displaying device – itdraws a graph of an electrical signal. In most applications, thegraph shows how signals change over time: the vertical (Y) axisrepresents voltage and the horizontal (X) axis represents time. Theintensity or brightness of the display is sometimes called the Zaxis.
The Agilent 54123A oscilloscope's simple graph can tell you manythings about a signal, such as: the time and voltage values of asignal, the frequency of an oscillating signal, the “moving parts”of a circuit represented by the signal, the frequency with which aparticular portion of the signal is occurring relative to, otherportions, whether or not a malfunctioning component is distortingthe signal, how much of a signal is direct current (DC) oralternating current (AC) and how much of the signal is noise andwhether the noise is changing with time.
Features
High Frequency Rejec
Features
High Frequency Rejec
Pulse Width
12 Bit A/D Converter
.25Ps Time Interval
Vertical Average Mod
Auto Pulse-Parameter
Four Channels
Step Generator
Time Voltage Hitogra
Hp-Ib
2.5Ghz Trigger Edge
Time Domain Reflecto
Digital Filters
备注:
我们的优势:
品种齐全,货源充足,存库雄厚,服务快捷,维修能力强。
欢迎来电!上门看货!价格好商量!您的满意是我们的追求!^_^
我公司对销售的仪器仪表均负责保修一年.
本公司长期供应/租赁/维修二手进口仪器
在线询盘/留言


